 Chai
The Possession Paradox: Why the Premier League Moved Away From the Ball
Authored by Sheikh
In 2025-26, Premier League teams with less than 50% of the ball won more games (139) than teams with more (137), the first time since 2005-06. Over the same season, the team that won more duels won 155 games to 111. This case study argues that the league has shifted from controlling the ball to winning contests and exploiting transitions, and shows how a club analyst could have detected the shift early with Big Data.
| Key question | Short answer |
|---|---|
| What was the event or problem? | Possession stopped predicting results in 2025-26, hurting clubs whose game model depends on it |
| How could Big Data have helped? | Season-level and match-level tracking of possession, duels and game state would have flagged the shift during 2024-25 |
| Which techniques and tools? | Descriptive trend analysis, correlation and partial correlation, binomial tests, and proposed game-state and xG models |
| How would the case study be structured? | Collect event data, clean and join it in an ETL pipeline, analyse at season, team and match level, and deliver a dashboard to coaching staff |
1. The situation
The problem: possession, the metric many Premier League game models are built around, lost almost all its link to winning in 2025-26. For a possession-dominant club, that is a strategic risk, not just a statistical curiosity.
Role. I am an analyst at a Premier League club whose game model relies on controlling the ball. The club’s assumption has been that more possession produces more wins.
What happened. Opta Analyst’s 20-season series shows the team with more possession won more games in every season from 2006-07 to 2024-25. In 2025-26 that flipped:
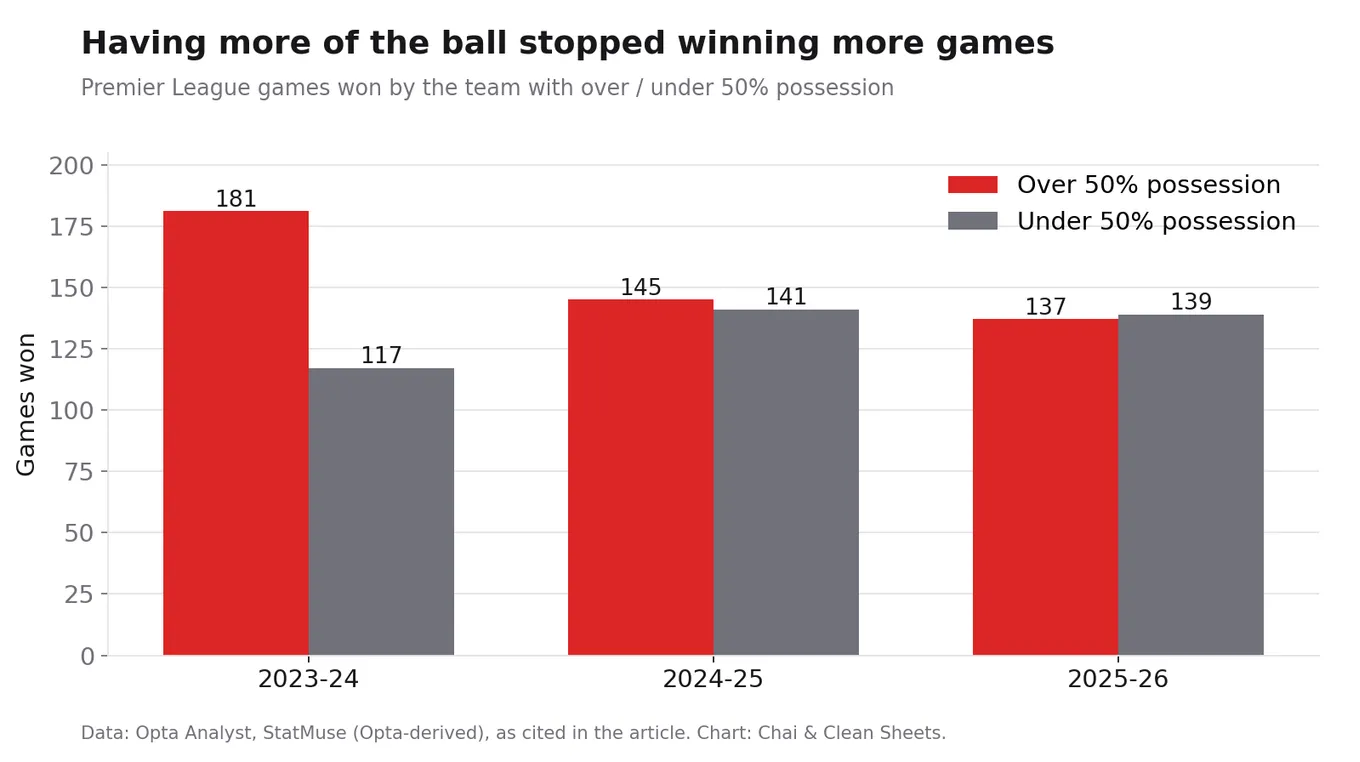
| Season | Wins, team with over 50% possession | Wins, team with under 50% possession |
|---|---|---|
| 2023-24 | 181 | 117 |
| 2024-25 | 145 | 141 |
| 2025-26 | 137 | 139 |
The gap had already shrunk from 64 wins to 4 in 2024-25, a season before the flip. A club monitoring this trend would have had a full season of warning.
Why it matters. If having the ball no longer wins games, a club built to dominate possession can lose to opponents who concede the ball, defend compactly and attack quickly in transition. The question for this case study is what replaced possession as the driver of results, and how data could have told us sooner.
2. What the data shows
The data shows that as possession became less decisive, winning individual contests became more decisive. Teams’ possession levels converged, and duel success took over as a predictor of results.
Data that should have been collected
- Event data per match: possession %, duels won and lost (ground and aerial), tackles, fouls, passes, long balls and goals with timestamps. Source: StatMuse (Opta-derived) and Opta Analyst.
- Game-state data: the score at every minute, so possession and actions can be split by winning, drawing and losing.
- Tracking data: player positions, sprints and defensive line height, to measure how deep a leading team sits.
- Chance-quality data: expected goals (xG) for and against, split by open play, transition and set pieces.
How it was processed
Team-season data for 2016-17 to 2025-26 and match-level data for every win from 2021-22 to 2025-26 (1,445 wins) were pulled from the StatMuse API. Each match was classified by whether the winning team won more duels than its opponent.
Insights generated
1. Duels are moving into the air, not increasing overall. Total duels per game stayed between 96 and 99 across five seasons. Aerial duels rose 21% in 2025-26, from 25.3 to 30.7 per game, while ground duels fell to a five-season low of 66.1.
2. Winning duels now predicts winning games. In 2025-26, the team winning more duels won 155 games and lost 111 (binomial p ≈ 0.007). In the same season, possession split wins almost evenly.
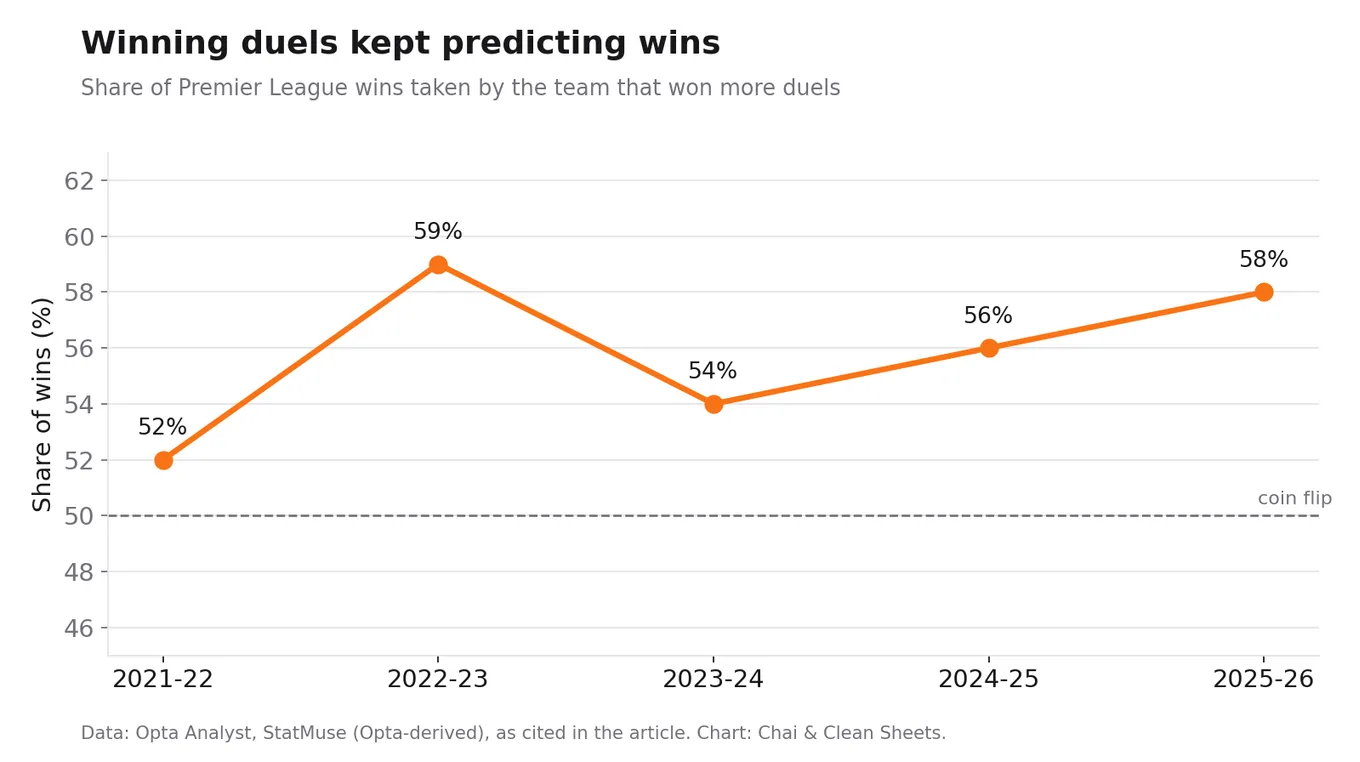
| Season | Winner won more duels | Winner won fewer duels | Share |
|---|---|---|---|
| 2021-22 | 147 | 136 | 52% |
| 2022-23 | 163 | 114 | 59% |
| 2023-24 | 152 | 131 | 54% |
| 2024-25 | 154 | 119 | 56% |
| 2025-26 | 155 | 111 | 58% |
3. Duel win % caught up with possession as a team-level predictor. Correlation of team duel win % with season wins rose from r = 0.26 in 2024-25 to r = 0.61 in 2025-26. Controlling for possession, it still predicted wins (partial r = 0.50, p = 0.03), the only season of five where it did.
4. Teams became more alike in possession. The gap between the highest- and lowest-possession team was 26 to 33 points for eight seasons, then fell to 21.4 in 2024-25 and 18.3 in 2025-26. Man City’s league-high share dropped from 71.8% (2017-18) to 60.6%, while the lowest team rose to 42.3%. When everyone has a similar share of the ball, having slightly more of it gives little edge.
5. Duel success spread did not narrow. The gap between the best and worst duel-winning teams stayed at 3.6 to 6.4 percentage points with no trend (p = 0.97). Small differences in duel success were enough to separate teams in 2025-26.
3. The techniques
Descriptive and diagnostic statistics establish the shift; predictive and prescriptive models would turn it into decisions for the coaching staff.
| Technique | Analysis type | Applied in this case |
|---|---|---|
| Season trend analysis | Descriptive | Wins by possession and by duels per season; duels per game; possession spread and standard deviation |
| Correlation and partial correlation | Diagnostic | Team duel win % and possession vs. season wins, controlling for possession to isolate duels’ own effect |
| Binomial and regression trend tests | Diagnostic | Whether duel-winners won significantly more often; whether spreads narrowed over time |
| Game-state segmentation (data mining) | Diagnostic | Possession, shots and xG split by winning, drawing or losing, to test whether the first scorer sits back |
| Logistic regression or gradient-boosted model (machine learning) | Predictive | Predict match result from pre-match form and in-game features such as duel win %, aerial share and transitions |
| Expected-points simulation | Prescriptive | Compare tactical options (keep the ball vs. concede it and counter after scoring) by simulated points gained |
The first three techniques were applied in this case study. The last three are proposed next steps that need game-state, xG and tracking data.
4. How the analysis is built
The case study runs as a four-stage pipeline, from raw match events to a weekly dashboard for coaches.
- Data collection
- Team-season stats (possession, duels, aerials, tackles, fouls, wins, points) for 2014-15 onward, the earliest season with duel data on StatMuse.
- Match-level stats for every game, both teams, including goal timestamps.
- Opta Analyst’s published possession-wins series as a cross-check.
- Proposed: tracking data (defensive line height, sprints) and xG per shot.
- Data processing and transformation (ETL)
- Extract: pull from the StatMuse API one season at a time, since responses are capped at 500 rows.
- Transform: convert possession strings to numbers, derive duel win % (won ÷ won + lost), flag the duel and possession winner per match, and split each match into game-state segments by goal minute.
- Validate: check win counts per season against league tables (all five seasons matched except one missing 2025-26 match), and confirm duels won ≈ duels lost league-wide.
- Load: store as season, team-season and match tables keyed by season and team ID.
- Data analysis
- Descriptive: per-season trends in possession, duels and spreads.
- Diagnostic: correlations, partial correlations and significance tests.
- Predictive and prescriptive: result model and expected-points simulation once game-state data is added.
- Results visualization
- Line chart of wins by possession and by duels per season, mirroring Opta’s format, so coaches can compare the two at a glance.
- High–low band chart of team possession per season, showing the convergence.
- Bar chart of correlation with wins (possession, duel win %, aerial win %) by season.
- In-match dashboard: live duel and aerial win % against the opponent, with a flag when the team falls below about 47%, the level of the league’s weakest duel-winning teams.
Conclusion
The Premier League is now increasingly played in a pattern where the team that scores first sits back, concedes possession and waits for transition opportunities. This is why teams with less possession won more games in 2025-26, and why winning duels, especially in the air, became a stronger predictor of results than having the ball.
What the evidence supports. Teams with less than 50% possession won more games in 2025-26 for the first time since 2005-06. Possession levels converged to their narrowest spread in ten seasons. Aerial duels jumped 21%, and duel-winners won 58% of decided games. Together these fit a league where contests and transitions decide matches more than control does.
What still needs testing. The game-state claim, that the first scorer drops deep, is the explanation this case study proposes but has not yet measured. Testing it needs possession, shots and xG split by score state, which is the next stage of the pipeline. The key check: whether teams’ possession falls after they take the lead, and whether that fall has grown since 2023-24.
How this resolves the problem. A possession-based club that tracked these metrics would have seen the possession-wins gap shrink from 64 to 4 during 2024-25 and could have adjusted before 2025-26. Practical responses include:
- Recruiting and training for aerial and ground duel success, not only ball retention.
- Preparing a plan for when the opponent leads and sits deep, since more possession alone is no longer enough to break them down.
- Rehearsing rest-defence to limit counter-attacks after losing the ball.
- Monitoring duel and aerial win % live, as the dashboard in section 4 proposes.
Limitations. Results are correlations, not proof of cause. Each season has only 20 teams, so single-season tests carry wide uncertainty, and the shift covers just two seasons. Possession figures come from Opta while duels come from StatMuse, so a final version should rebuild both series from one source. One 2025-26 match was missing from the match-level data.
Sources
- Opta Analyst, Premier League Wins by Possession, 2005-06 to 2025-26.
- StatMuse API (Opta-derived): team-season and match-level stats, 2014-15 to 2026-27, retrieved 5 November 2026.
- Tomkins Times, aerial duels in 2025-26 (early-season context).
- Opta Analyst, Premier League teams more direct in 2025-26.
What do you make of it: is the Premier League really leaving possession behind, or is this a two-season blip? Tell Sheik on YouTube or Instagram.
Got a take? We want to hear it.
The debate lives on YouTube and Instagram — that's where our community argues formations, rates performances, and talks Liverpool. Drop your thoughts there and join in.